


ללמוד להבין תרשימי Forex הוא מרכזי עבור כל סוחרי Forex. תרשימים אלה הם כלי חיוניים. הם עוזרים לך לראות מגמות שוק ושינויי מחירים. זה יכול להראות לך איפה ההזדמנויות למסחר. מומחים, כמו אלה ב- Investopedia, מסכימים שידע כיצד לקרוא את התרשימים הללו הוא חיוני. זה מאפשר לך לנבא מה יעשו המחירים לאחר מכן. לכן, להתמקם בקריאת תרשימי Forex בצורה טובה יכול לשפר באמת את המשחק שלך במסחר ולהפוך אותך לטוב יותר בניתוח השוק.
מסקנות מרכזיות
- תרשימי Forex הם חיוניים להבנת מגמות שוק.
- קריאת תרשימים יעילה משפרת אסטרטגיות מסחר.
- ניתוח טכני תלוי באופן משמעותי בפרשת התרשימים.
- ניתן לנבא תנועות מחירים דרך תרשימים.
- יסוד חזק בקריאת תרשימים יכול לשפר ניתוח שוק.
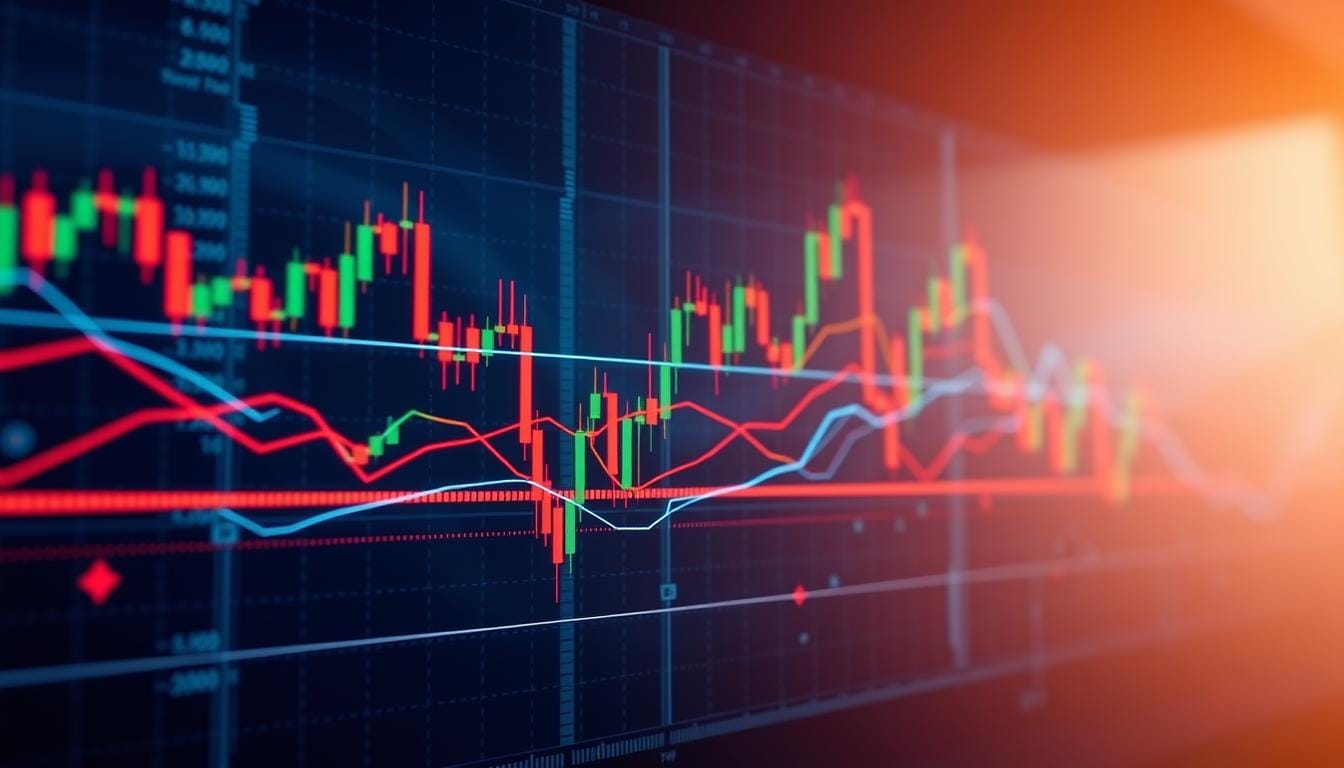
מבוא לתרשימי Forex
מסחר ב- Forex הוא מיוחד מאחר שיש לו דרכים משלו בהשוואה לשווקים אחרים. הכל סובב סביב מטבעות. מטבע אחד מוחלף במטבע אחר. דברים כמו גורמים כלכליים משחקים תפקיד חשוב. המונח 'פיפס' גם חשוב. זה אומר את השינוי הקטן ביותר במחיר במטבע.
שוק ה-FOREX. זה חשוב לסוחרים כאשר הם בודקים את פעולות השוק שלהם.
הבנת היסודות של מסחר ב-FOREX
ה-שוק ה-FOREX פתוח 24 שעות בכל יום. לכן, סוחרים צריכים לדעת מה קורה בכל עת. דברים כמו מדדים כלכליים, ריבית ואירועים פוליטיים משנים את ערכי המטבע. לדעת איך כל אלה עובדים ביחד עוזר לסוחרים לקבל החלטות מסחר טובות.
התפקיד של תרשימים בשוק ה-FOREX
תרשימים הם חיוניים למסחר ב-FOREX. הם מראים פעולות מחיר בעבר בדרך שקל לראות. זה עוזר לסוחרים לזהות מגמות ותבניות לאורך זמן.
הבנת תרשימים טובה מאפשרת לסוחרים לפעול מהר על שינויים בשוק. תרשימים מראים זמנים טובים להיכנס או לצאת מעסקאות. להתמקם ביסודות של ה-FOREX ובנית תרשימים היא מפתח. זה עוזר לסוחרים להצליח בעולם המהיר של מסחר ב-FOREX.
סוגי תרשימי FOREX
סוחרים משתמשים בתרשימים שונים כדי להבין את תנועות המחירים ב-FOREX. לדעת איך עובדים תרשימים אלה משפר את תהליך הקבלת ההחלטות. זה עוזר לסוחרים לבחור את התרשים הנכון לסגנונם. נבחן את
תרשימי נרות, תרשימי קווים, ו־תרשימי עמודים.
תרשימי נרות: יתרונות ופרשנות
תרשימי נרות הם מועדפים מאחר שהם מציגים המון מידע. הם מציגים את מחירי הפתיחה, הגבוה, הנמוך, והסגירה. זה עוזר לסוחרים להבין את מצב השוק ולזהות מגמות. כמה נקודות חיוביות הן:
- הם קלים לקריאה ומציגים שינויים במחיר לאורך זמן.
- הם עוזרים למצוא דפוסים שמסמנים שינויים במחיר.
- הם עושים את זה פשוט יותר לראות איך סוחרים מרגישים לגבי השוק.
תרשימי נרות מאפשרים לסוחרים לראות דפוסי שוק בבהירות. דפוסים כמו "דוג'י" ו"פטיש" מרמזים על שינויים במחיר.
תרשימי קווים ותרשימי עמודים: הבדלים מרכזיים
תרשימי קווים ו־תרשימי עמודים גם מציגים שינויים במחיר, אך בדרכים שונות.
| תכונה | תרשימי קווים | תרשימי עמודות |
|---|---|---|
| ייצוג נתונים | הם מחברים מחירי סגירה בקו. | הם מציגים מחירי פתיחה, גבוהים, נמוכים וסגירה בזמנים מסוימים. |
| רמת מורכבות | פשוט, טוב לראות מגמות ארוכות. | מורכב יותר, נהדר לניתוח עמוק. |
| שימושיות | הטוב ביותר למתחילים או לצפייה במגמות. | טוב לבדיקת תנועות שוק ותחושות. |
בחירת התרשים הנכון עוזרת לסוחרים ליצור אסטרטגיות טובות יותר. תרשימי קווים פשוטים את צפיית הטרנד. תרשימי עמודות מפרטים את התנועה במחיר. שימוש בסוגי תרשימים שונים משפר ניתוח שוק.

כיצד לקרוא תרשימי פורקס
ללמוד לקרוא תרשימי פורקס הוא מרכזי לקבלת החלטות מסחר חכמות. זה כולל את זיהוי הטרנדים והתבניות, מציאת רמות תמיכה והתנגדות, ושימוש ב-אינדיקטורים של פורקס לניתוח טוב יותר.
זיהוי טרנדים ותבניות
ניתוח טרנדים הוא נושא חשוב במסחר בפורקס. סוחרים מסתכלים על תבניות כמו ראש וכתפיים, דגלים ומשולשים. הצורות הללו יכולות להראות מה המחירים עשויים לעשות לאחר מכן. זיהוי התבניות הללו עוזר לסוחרים לנחש לאן השוק עשוי להתקדם. זה עושה את העסקאות שלהם יותר סבירות להצליח.
הבנת רמות תמיכה והתנגדות
רמות תמיכה והתנגדות חשובות מאוד במסחר. הן מראות איפה המחיר עשוי לעצור או לשנות כיוון. תמיכה היא רמת מחיר שבה הביקוש חזק מספיק כדי לעצור את המחיר מהמשך הירידה. התנגדות היא המקום שבו מכירה מונעת מהמחיר לעלות. לדוגמה, אם זוג מטבעות נמכר חזרה למעלה ממחיר מסוים בתדירות, זו רמת תמיכה חזקה. סוחרים משתמשים בידע זה כדי למקם את העסקאות שלהם בצורה יותר טובה, ומטרתם להרוויח יותר כסף.
שימוש באינדיקטורים לשיפור הניתוח
אינדיקטורים בפורקס מעניקים תובנות עמוקות בטרנדים ובמצבי השוק. דברים כמו ממוצעים נעים ומדד רמת העוצמה היחסית (RSI) הם מועדפים לניתוח. ממוצעים נעים עוזרים להבין נתוני מחיר בצורה יותר פשוטה על ידי הצגת כיוון הטרנד. RSI בודק כמה מהר ובכמה המחירים משתנים, מראה האם דברים נמכרים יותר מדי או נמכרים ביותר מדי. שימוש באינדיקטורים אלה משפר את הניתוח, מוביל לבחירות מסחר חכמות יותר.

| מדד | מטרה | יישום |
|---|---|---|
| ממוצע נע | מחליק נתוני מחיר | מזהה כיוונים במגמה |
| מדד כוח יחסי (RSI) | מודד מהירות תנועת מחיר | מציין תנאי יתר קנייה/מכירה |
| צמד רצועות בולינגר | מעקב אחר התנודות במחיר | מזהה היפוך פוטנציאלי במחיר |
| MACD | מציג את הקשר בין שני ממוצעים נעים | מזהה תנודות רגש בולישיות ודובישיות |
שגיאות נפוצות בקריאת תרשימים
קריאת תרשימי הפורקס חיונית להצלחת הסוחר. רבים עושים שגיאות שמשפיעות על המסחר שלהם. לדעת את השגיאות הללו משפר את האסטרטגיות והתוצאות.
הפשטת ניתוחים
רבים משתמשים ביותר מדי אינדיקטורים, מה שיוצר ניתוחים מורכבים. יותר מדי אינדיקטורים עשויים לבלבל ולהסתיר את האותות הברורים. גישה פשוטה לקריאת תרשימים עוזרת לבצע עסקאות מהירות ויעילות.
התעלמות מהקשר השוק המרכזי
הקשר של השוק חיוני למסחר. להתעלם מחדשות או ממצבי השוק עשוי לגרום לפספוסים או לכישלונות. סוחרים צריכים לשלב קריאות תרשימים עם מידע חיצוני. לדוגמה, אות חיובית בתרשים עשויה להיות שגויה אם הכלכלה נכשלת. לדעת את השוק היטב מוביל להחלטות טובות יותר ומפחית שגיאות.
התעלמות מאסטרטגיות ניהול סיכון
ניהול סיכון הוא מרכזי במסחר. חלק מהסוחרים מתמקדים רק ברווחים, שוכחים להגן על ההשקעות. ניהול סיכון טוב כולל קביעת הזמני עצירה ובחירת גדלי פוזיציה בצורה חכמה. לשכוח משלבים אלה עשוי לגרום להפסדים גדולים. לאיזון תמריצים עם סיכון חיוני להצלחה ארוכת טווח.

| שגיאה | השפעה | אסטרטגיית תיקון |
|---|---|---|
| הפקפוק בניתוחים | בלבול ואותות שנאבדים | הגבלת אינדיקטורים למטרת בהירות |
| התעלמות מהקשר השוק המרכזי | הפסקת הזדמנויות, עסקאות נכשלות | שילוב חדשות חיצוניות ונתונים |
| התעלמות מניהול הסיכון | הפסדים כספיים משמעותיים | יישום הוראות לעצירת הפסדים, והערכת סיכון |
מסקנה
הבנת מסחר בפורקס היא מפתח להצלחה במסחר. לשלוט בקריאת תרשימים היא חיונית. זה עוזר לסוחרים לקבל החלטות חכמות.
כל תרשימי הנר וה-קו מציעים תצפיות ערכיות של השוק. הם מציגים מגמות שוק בצורה ברורה, עוזרים ביצירת אסטרטגיות טובות יותר.
כדי להשתפר, עליך להמשיך לתרגל וללמוד. שוק ה-פורקס משתנה לעיתים תכופות, ולהישאר מעודכן עם אסטרטגיות חדשות ומגמות היא חשוב. לחזור על עקרונות של תמיכה והתנגדות ולהשתמש באינדיקטורים יכול לשפר את הסיכויים שלך לניצחון.
להפוך למקצוען בקריאת תרשימים דורש זמן ומאמץ. זה חיוני לכל סוחר שרוצה להצליח בטווח הארוך. המשך ללמוד ולשפר את כישורי המסחר בפורקס שלך, ותוכל להגיע ליעדי הכספיים שלך בביטחון.
שאלות נפוצות
מהם היתרונות העיקריים של קריאת תרשימי פורקס?
איך אני יכול להתחיל ללמוד על מסחר בפורקס?
התחלת לסחור בפורקס כוללת קריאה, השתתפות בקורסים מקוונים ותרגול על חשבונות דמו. להכיר את השפה, את פעולת השוק ואת דרכים לניהול סיכונים הם חשובים. השלבים הללו מסייעים לפתיחת דרך להצלחה.
מהם גרפי נרות יפהפיים ואיך הם שונים מסוגים אחרים?
גרפי נרות יפהפיים הם פופולריים בקרב סוחרי פורקס. הם מציגים את מחירי הפתיחה, הסגירה, הגבוה והנמוך לתקופה. הם שונים מ-גרפי קו, שרק מציגים מחירי סגירה, ומ-גרפי ברים, שמציגים נתונים בצורה שונה.
מהם רמות תמיכה והתנגדות במסחר בפורקס?
רמות התמיכה מונעות ממחירים לרדת יותר מדי, עקב דרישה חזקה. רמות ההתנגדות מתרחשות כאשר מכירה מונעת ממחירים לעלות יותר מדי. לזיהוי של רמות אלו עוזר לסוחרים לקבל החלטות.
איך אני יכול לשפר את ניתוח השוק שלי באמצעות מחוונים?
שפר את ניתוח השוק על ידי הוספת מחוונים כמו ממוצעים נעים, RSI ו-MACD לתרשימים. כלים אלה מציעים תובנות נוספות. הם עוזרים לזהות מגמות ונקודות בהן המחירים עשויים לשנות כיוון.
אילו טעויות נפוצות כדאי לי להימנע מהן בקריאת תרשימי הפורקס?
חשוב לא להפוך את הדברים למורכבים מדי עם יותר מדי מחוונים, להתעלם מהקשר השוקי החיוני ולשכוח מניהול הסיכון. להיות מודע לבעיות אלו עשוי להוביל לתוצאות מסחר טובות יותר.
איזה תפקיד נישא בחדשות כלכליות במסחר בפורקס?
חדשות כלכליות משפיעות באופן משמעותי על ערכי מטבע ועל דרכי תנועת השווקים. סוחרים חייבים לעקוב אחר דיווחים וחדשות חשובים. הידע הזה חיוני לקבלת החלטות מסחר מושכלות.
האם ישנם משאבים מומלצים לשיפור כישורי קריאת תרשימי הפורקס שלי?
ישנם מקורות רבים שיכולים לעזור, כולל קורסים מקוונים, פורומים למסחר וספרים שנכתבו על ידי מומחים. אתרים כמו Investopedia ו־Babypips מספקים מדריכים ומדריכים נהדרים לניתוח תרשימי ה־Forex.
